
The economic knock-on effects of the Russian invasion of Ukraine are going to be felt throughout Europe. While the overall economic fallout is still difficult to predict, the impact will be different for different member states. This brief takes a very first look at potential differences in exposure, focusing on direct trade links, potential costs of energy dependence on Russia and vulnerabilities towards rising energy prices more generally. It shows that the EU’s member states’ economic vulnerability to the Russian invasion of Ukraine is very unevenly distributed. To cushion the economic blow and ensure political unit, the EU will need to share some of the economic burden of this crisis.
The economic knock-on effects of the Ukraine war are going to be felt throughout Europe. Direct costs from sanctions and trade disruptions, rising inflation due to higher energy and commodity prices and mounting uncertainty will become a drag on Europe’s economy. The overall economic costs of the war are still difficult to predict. However, the impact will be different for different member states. After the pandemic, the Russian invasion of Ukraine is yet another external economic shock with asymmetric consequences across Europe.
This unequal distribution of the economic hardship across EU member states is not only an economic problem: it matters politically. Making sure that Europe sticks together in the coming months and possibly years in the face of Russia’s aggression will require burden-sharing to avoid some member states being affected much more than others. But which countries will be hit the hardest and why? This brief takes a very first look at potential differences in exposure across member states. It focuses on direct trade exposure as well as the potential costs of energy dependence on Russia and vulnerabilities towards rising energy prices more generally.
This first peek at the data reveals some important patterns. First, Central and Eastern European countries are especially vulnerable across a range of factors. This includes export dependence, reliance on energy imports from Russia as well as a pronounced exposure to general price hikes for energy. Second, Germany and Italy stand out as countries that are heavily dependent on Russian gas but also could be hit by supply shortages in the automotive industries. Third, the overall effect of rising energy prices differs across member states. While it would be especially hard to stomach for poorer countries in the East with colder winters, energy-intensive economies in Northern and Western Europe would also suffer disproportionally. As a result, it is likely that the EU will need to share this burden equally to keep political unity.
Exposure to trade disruptions – Low but concentrated
The war disrupts trade relations between the EU and Russia. The EU’s direct trade sanctions are limited to specific sectors such as arms, dual-use goods and the aviation and space industry. However, financial sanctions and especially the ban of seven Russian banks from SWIFT will significantly increase trade costs outside the energy sector. For comparison, a full SWIFT ban on Iran reduced the country’s trade by almost a third. In addition, we already see scores of companies severing or reducing relations with Russia even in sectors that are not subject to sanctions, presumably due to skyrocketing reputational costs of continued business in Russia.
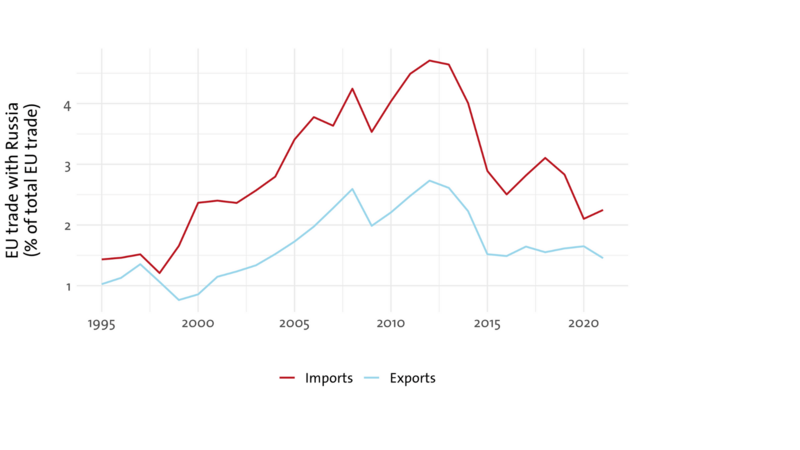
What does this mean for the EU? Overall, trade relations with Russia play a minor role for Europe. While the EU is Russia’s main trading partner and makes up almost half of the country’s total exports, Figure 1 shows that the relevance of trade with Russia for the EU is low, outside the energy sector. Moreover, trade has been on a steady decline since the Russian annexation of Crimea and the implementation of a first round of economic sanctions by the EU in 2014.
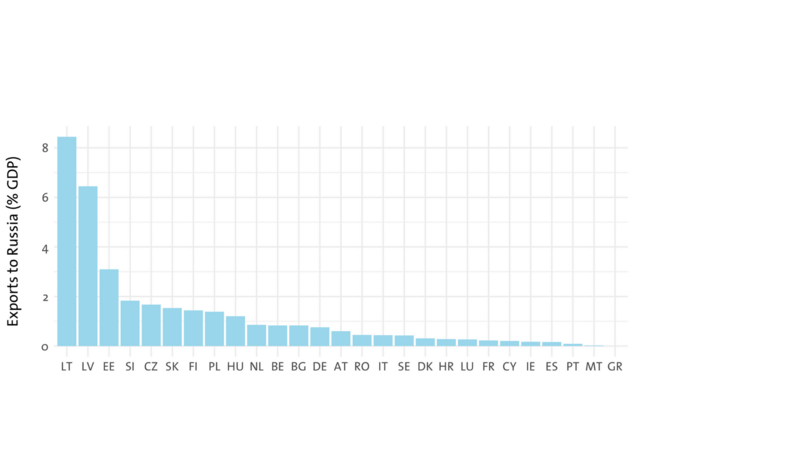
However, these overall figures hide substantial differences across countries. This is especially important when it comes to exports. To date, Russia remains the largest export market for Latvia and the second largest for Lithuania. Similarly, while exports to Russia are negligible for most Western and Northern European countries, they do play a substantial economic role for most Central and Eastern European economies (see Figure 2).
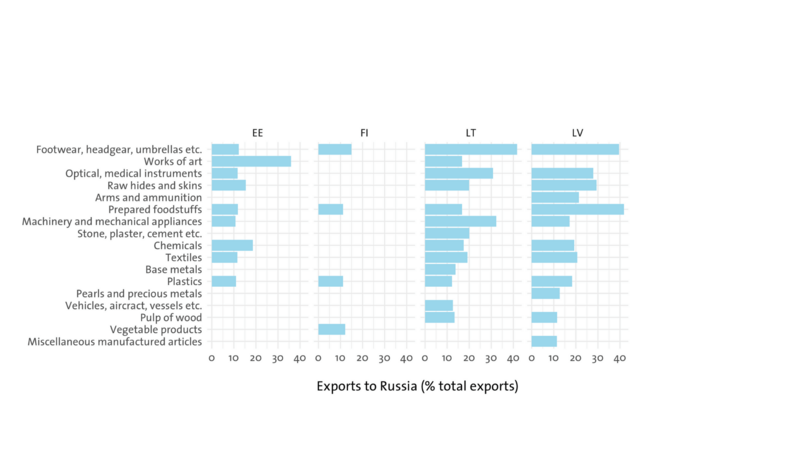
These vulnerabilities become especially clear when looking at specific sectors. Figure 3 plots all product lines for which exports to Russia constitute more than 10% of all national exports in EU member states. Again, risks seem to concentrate mostly in the Baltics. In Estonia, Latvia, Lithuania but also Finland, rising trade barriers due to financial sanctions or reputational costs could quickly turn into a major issue as, for example, more than 30% of all machinery and mechanical appliance exports from Lithuania and more than 40% of all foodstuff exports from Latvia went to Russia in 2019.
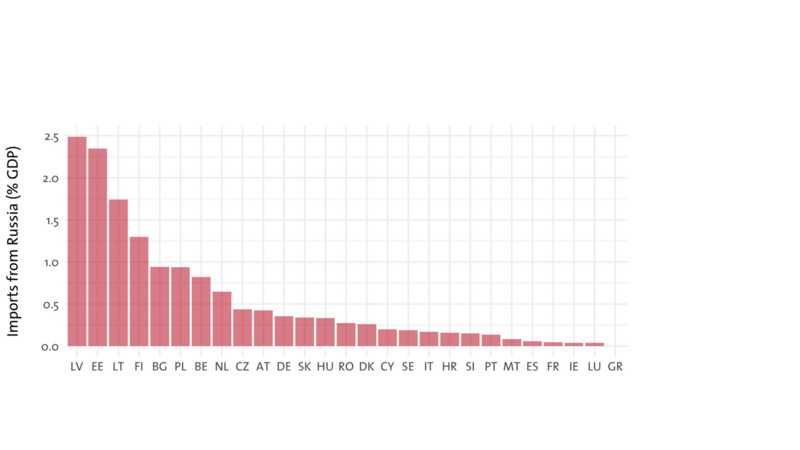
When it comes to imports, direct trade risks are less evident. Again, trade relations with Russia outside of the energy sector are especially strong in Eastern Europe and the Baltics but even in these countries their overall importance in the economy is comparatively small (see Figure 4).
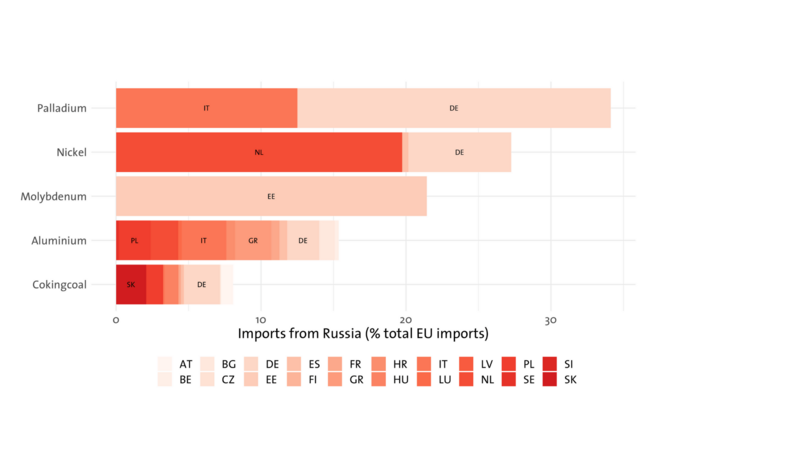
However, for imports, sector-specific bottlenecks are often more important than overall trade volume. While these vulnerabilities are more difficult to trace and depend on the make-up of complex supply chains, some factors do stand out. For example, Russian wood makes up half of all Finnish wood imports and is a crucial input to the country’s forestry industry which accounts for 20% of all industry production and 15% of industry employment. Similarly, farmers across Europe rely heavily on imported feed crops from Ukraine and, at the same time, strongly depend on Russia and Belarus for fertilizers. Most importantly, Russia is one of the world’s leading commodity exporters and features high on the EU’s list of producers of critical raw materials. The EU, for example, relies heavily on Russian palladium, a precious metal that is embedded in engine exhausts to reduce emissions. Shortages here have already led to price hikes and could quickly translate into supply-chain issues especially for the German and the Italian automotive industries (see Figure 5). At the same time, Russia also accounts for large chunks of the EU’s total imports of nickel and aluminum; disruptions in the trade flows in these areas could therefore severely impact the block’s steel, manufacturing, and construction industries.
The direct economic costs of disruptions of trade with Russia are, thus, overall limited but heavily concentrated in the Baltics and some CEE member states. In these countries, trade disruptions could shave off a substantial share of overall exports and could induce direct economic pain. When it comes to imports, sectors outside of energy are less relevant. However, sector-specific shortages for key agricultural and industry inputs could mean a blow for some important industries, especially in the EU’s farming and manufacturing powerhouses.
Exposure to energy imports and rising energy prices
The second main channel by which the Russian invasion of Ukraine will affect the EU’s economy is through rising energy prices. There are two ways in which member states will be impacted: first, through direct dependence on Russian energy imports; second, through rising gas, oil and coal prices on global energy markets as a result of the current conflict. This section discusses these factors in turn.
Dependence on energy imports from Russia
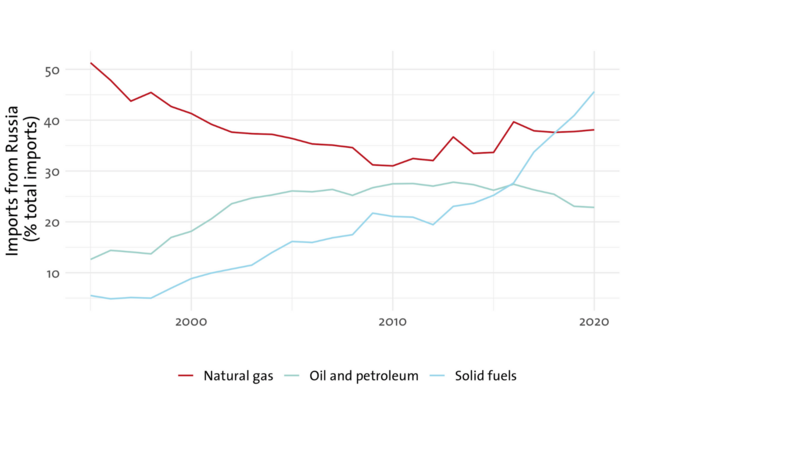
First, the EU relies heavily on energy imports from Russia. As Figure 6 shows, in 2020, the EU imported about 23% of its oil, 40% of its natural gas and almost 45% of its total coal imports from Russia. Importantly, while trade in other sectors has been declining since the annexation of Crimea and the start of the war in the Donbass in 2014, gas and coal imports have, in particular, remained on a steady climb since then.
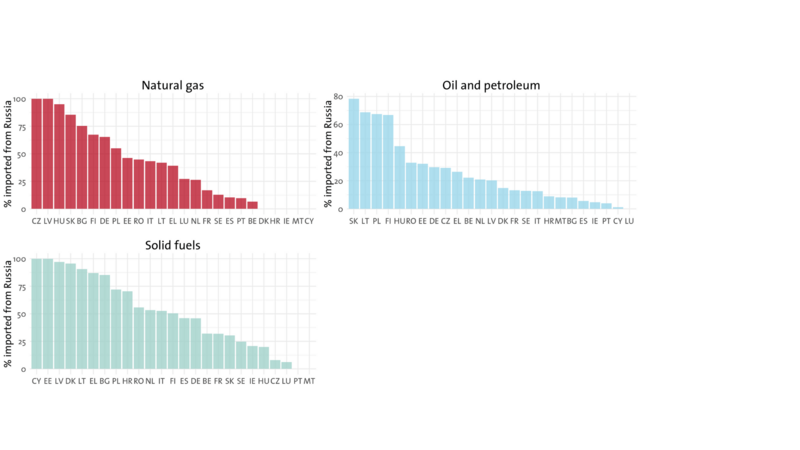
Again, these direct dependencies are not distributed equally across member states. As with overall trade, CEE member states rely much more heavily on Russian energy imports than the rest of the EU. For example, Latvia and the Czech Republic receive all their gas imports from Russia. Similarly, Latvia and Hungary also rely almost entirely on Russian imports when it comes to natural gas, whereas direct dependencies are much less pronounced in some Northern and Southern member states.
It is important to note that these imports are currently not directly affected by any financial or trade sanctions. In fact, both the EU and most other Western allies have explicit carveouts for energy related goods in their current sanctions regime. However, discussions on extending economic sanctions to oil and gas are well under way, reports about self-sanctions from Western firms make it already harder for Russian companies to sell their oil abroad and the possibility of Russian counter-sanctions specifically targeting energy exports has been floated prominently. How exposed would different member states be to such a widening of energy sanctions?
In the short run, it would be especially hard to stomach for those countries that rely heavily on Russian natural gas. As distribution of gas relies on pipelines and other physical infrastructure, import losses would be even more difficult to compensate than for other energy sources. To gauge member states’ vulnerabilities towards energy sanctions, Figure 8, therefore, plots the share of gas that is imported from Russia against the share of gas in a countries’ total energy consumption.
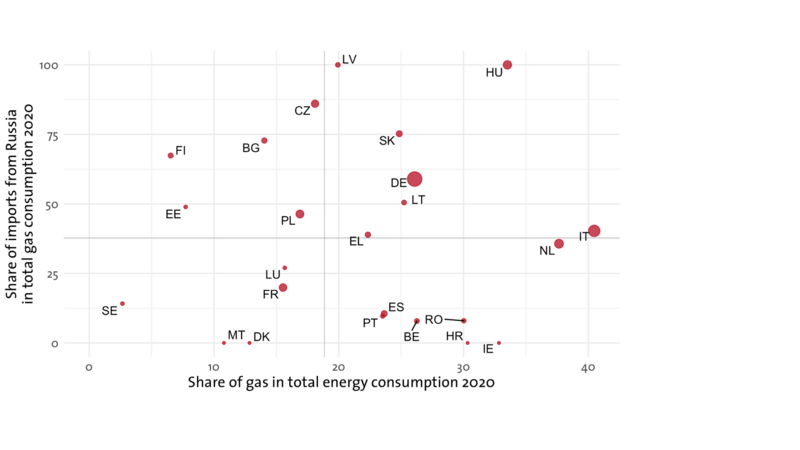
This figure shows that vulnerabilities are especially pronounced in CEE countries such as Hungary, Slovenia or Latvia. Besides that, Germany and Italy stand out as member states that both depend on a lot of gas in their national energy consumption and, at the same time, import large shares of their gas from Russia. Moreover, the two countries are also the largest gas importers in the EU in absolute terms.
Vulnerability towards rising energy prices on world markets
When it comes to direct energy dependence on Russia, vulnerabilities, thus, concentrate in CEE countries, Italy, and Germany. However, energy markets are global, and supply shortages will thus affect all member states. In fact, both oil and natural gas prices have skyrocketed from already high levels in recent days and according to the European Central Bank (ECB) energy price inflation will become one of the main economic challenges resulting from the war. A key question is therefore to what degree EU member states differ in their exposure to rising energy prices.
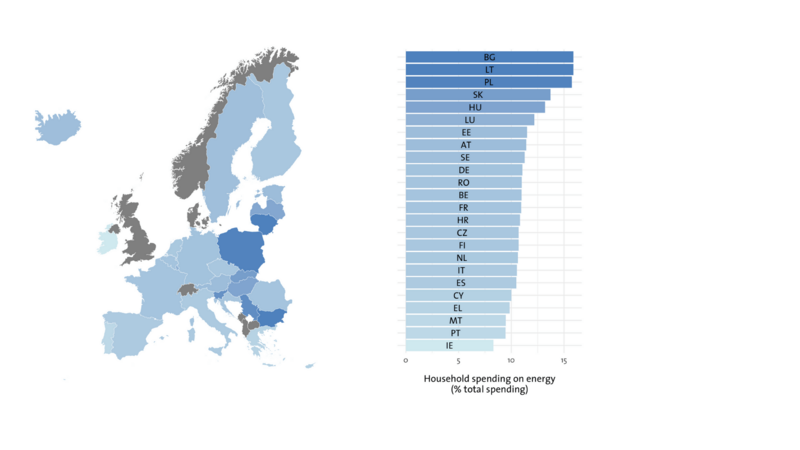
To get a preliminary idea about the possible distribution of costs, Figure 9 plots the percentage of household spending dedicated to energy related items in each member state. The higher this share, the more rising energy prices will eat into other expenditures and the greater the potential need for fiscal compensation. The chart shows large differences across countries. While, for example, Portuguese households spend less than 10% of their expenditures on energy and transport, the share reaches almost 16% in Bulgaria. Overall, Figure 9 shows that rising energy prices are likely to hit households in relatively poor and relatively cold CEE countries considerably harder than those in other member states.
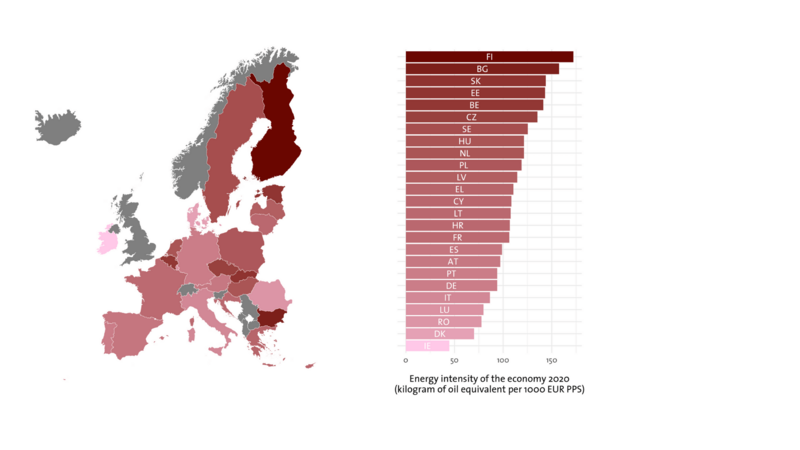
Figure 10 complements this with a measure of how much rising energy prices would hit the production side of the economy. In order to do so, it shows energy intensity as a measure of how much energy is needed per unit of GDP across member states. Again, differences within the EU are stark. While rising energy prices, again, will be especially hard for energy intensive economies in Eastern Europe, vulnerabilities are somewhat wider spread than for the household sector. For example, energy intensive economies in Finland, Belgium and the Netherlands also belong to the group of countries that would suffer disproportionally from rising prices for oil, gas and coal.
Conclusion
As this preliminary analysis shows, the EU’s member states’ economic vulnerability to the Russian invasion of Ukraine is very unevenly distributed. This holds for direct trade with Russia in non-energy goods as well as for the dependence on Russian energy imports and for the vulnerability to increasing energy prices on world markets. At the same time, keeping the 27 united in the response to Russia will be paramount in the months and potentially years to come. This will likely require burden sharing that takes these differences in vulnerability and economic fallout into account to avoid differential economic impact, potentially causing those member states hit hardest to drop out of the united front against Putin.